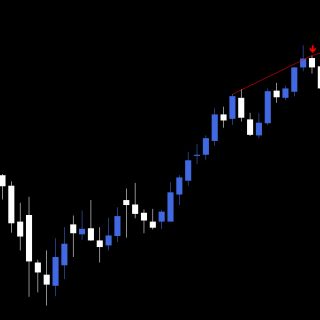
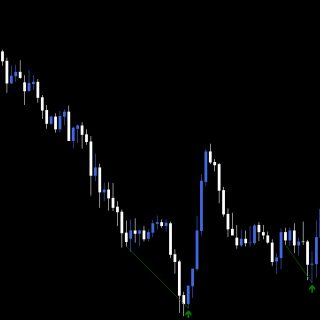
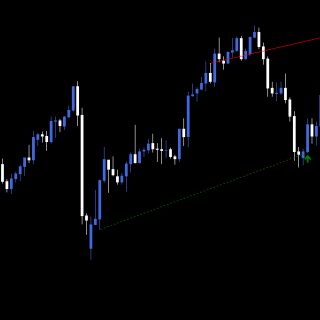
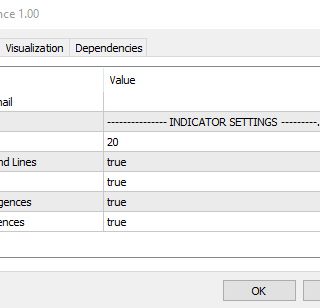
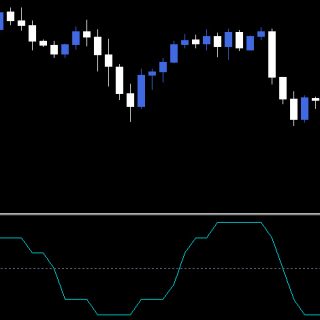
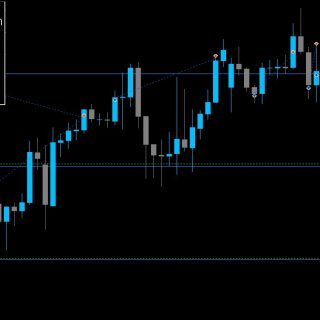
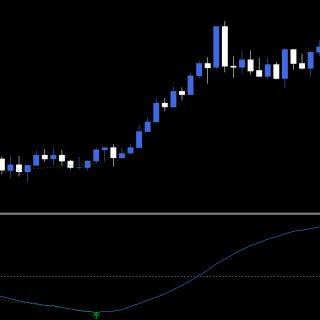
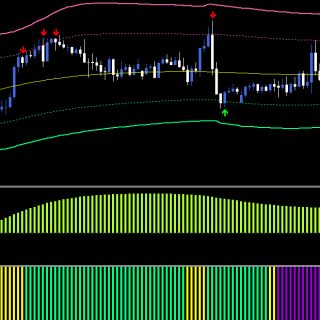
Our trend divergence indicator is based upon an innovative zero-lag, price action cycle phase implementation. A superimposed cyclical trend analysis is performed to produce an exact synchronisation with the trend cycle component in the data. The algorithm will assess the significance between a given slope and each data point of the trend cycle period and seek classical and hidden price divergences.
For a detailed overview of how the price action divergence indicator works & how to trade using the tool, please visit our wiki page.
Trend Divergence Dashboard (Optional)
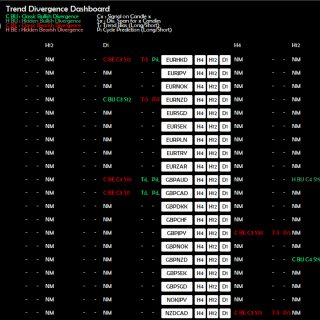
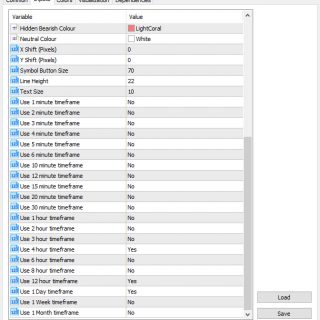
Divergence signals are produced at a lesser frequency than other indicators. For this reason, it is crucial to monitor a large number of symbols to find possible trading opportunities. We have designed a dashboard to scan as many symbols as the user desires, and provide further information about the signal, extending beyond the scope of the divergence signal.
Our dashboard will alert you of any new signals, but will also provide:
- Candle index for which the signal was produced
- Number of candles for which the divergence spans across
- Lag reduced indication of Trend Direction
- Zero lag prediction attempt based upon Cyclical Price Action analysis
Our dashboard is fully interactive, allowing for an easier trading experience. Each symbol has an associated button, for each selected time frame. Clicking the button instantly opens the chart, saving the hassle of scrolling through the Market Watch to find the symbol.


