Subscriptions
Triangular Moving Average TMA Indicator
$15 / month with a 14-day free trial and a $1 sign-up fee
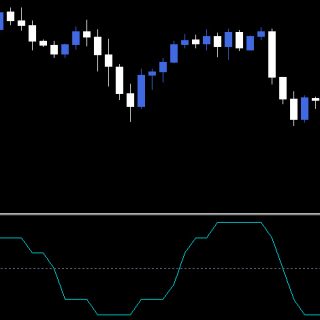
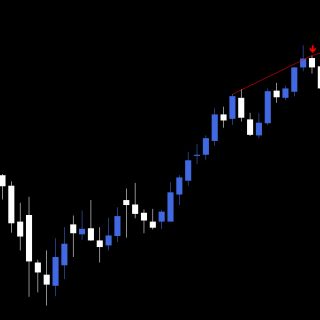
The Triangular Moving Average (TMA) is a Moving Average that has been averaged again (i.e. averaging the average); this creates an extra smooth Moving Average line. Generally, moving averages are smooth, but the re-averaging makes the Triangular Moving Average even smoother and more wavelike.
Product Description
What is the Triangular Moving Average (TMA)?
The Triangular Moving Average (TMA) is a Moving Average that has been averaged again (i.e. averaging the average); this creates an extra smooth Moving Average line. Generally, moving averages are smooth, but the re-averaging makes the Triangular Moving Average even smoother and more wavelike.
The TMA is a weighted average of the last n prices (P), whose result is equivalent to a double smoothed moving average:
SMA = (P1 + P2 + P3 + P4 + … + Pn) / n
TMA = (SMA1 + SMA2 + SMA3 + SMA4 + … SMAn) / n
For a detailed overview of how the indicator works & how to trade using the tool, please visit our wiki page.
For more details on all types of moving averages, check out our comprehensive trading guide.
TMA Redrawing
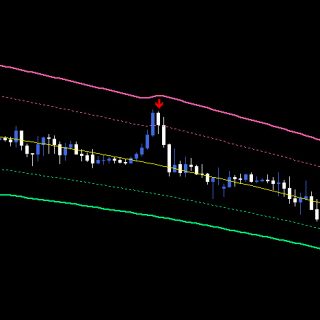
Our TMA system takes the foundations from above, and implements a central gravity shift. The central shift requires extrapolation of data, but there is no 100% exact way of extrapolating data. So, that extrapolated gap is a subject of changes no matter what extrapolation method one uses. For this reason, there is an unavoidable redrawing aspect to this system.
Once the indicators have been loaded on the chart, they will not redraw. If a trading signal appears for a closed candle, it will not disappear.
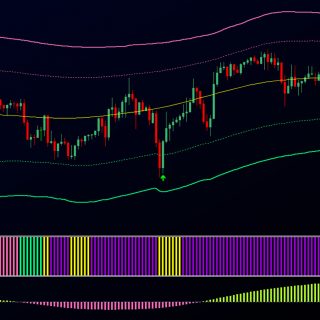
TMA Channel Helper (TMA-CH)
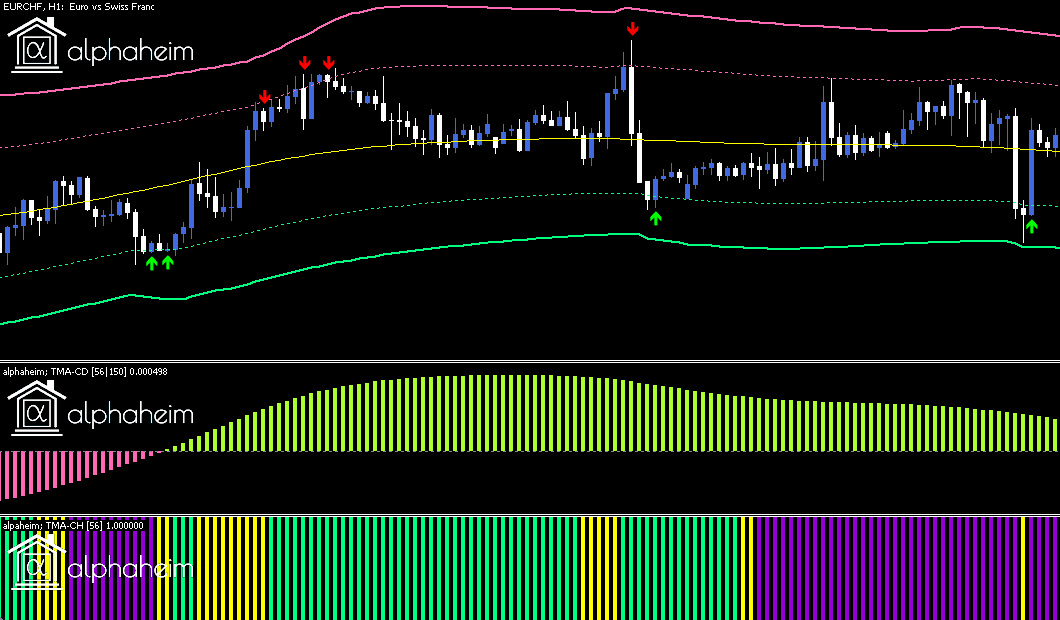
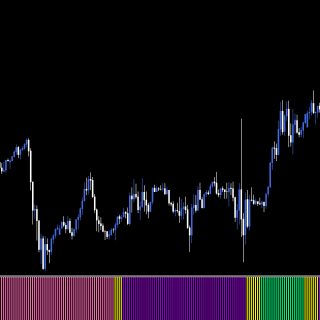
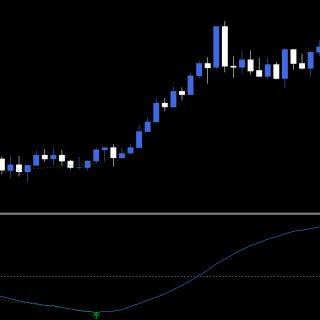
The Triangular Moving Average Channel Helper indicator will help identify if a symbol is ranging, or about to break out of range. The indicator will plot a histogram with four different colour options to signify a long/short non-ranging market, the start/end of a range, and a ranging market.
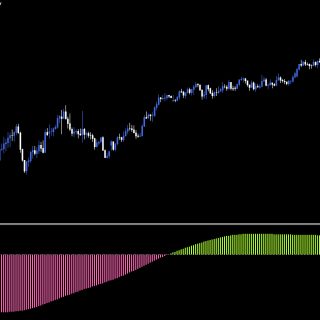
TMA Convergence/Divergence (TMA-CD)
The Triangular Moving Average Convergence/Divergence indicator will provide information very similar to a conventional MACD indicator. We have designed it to be a trend-following momentum indicator that shows the relationship between TMA’s of a symbol’s underlying price data. The TMA-CD is calculated by taking the delta of two specified TMA lines, one fast, and one slow.
What’s Included with Triangular Moving Average?
![]() TMA [Bands] Indicator for MetaTrader 4 or MetaTrader 5
TMA [Bands] Indicator for MetaTrader 4 or MetaTrader 5
![]() TMA-CH Indicator for MetaTrader 4 or MetaTrader 5
TMA-CH Indicator for MetaTrader 4 or MetaTrader 5
![]() TMA-CD Indicator for MetaTrader 4 or MetaTrader 5
TMA-CD Indicator for MetaTrader 4 or MetaTrader 5
![]() Complimentary Bonus: Price Action & Timing Indicators for MetaTrader 4 or MetaTrader 5
Complimentary Bonus: Price Action & Timing Indicators for MetaTrader 4 or MetaTrader 5
![]() Comprehensive user guide on indicator usage and trading strategy
Comprehensive user guide on indicator usage and trading strategy
![]() Full UK based support via live chat, email or phone
Full UK based support via live chat, email or phone
MetaTrader Trading Indicators & EAs
Trend Bias Indicator
Grid Expert Advisor
Trend Divergence Indicator
Volume Insight & Divergence Indicator
Dynamic Trend Duo Expert Advisor
All alphaeim EAs, indicators & Dashboards
alphaheim Trading Tools for MetaTrader
- Moving Averages
- TMA
- TMA CD
- TMA CH
- TMA Channel Helper
- TMA Convergence Divergence
- TMA Indicator
- TMA Indicator for MetaTrader
- TMA Indicator for MT4
- TMA Indicator for MT5
- TMA MetaTrader
- TMA MetaTrader 4
- TMA MetaTrader 5
- TMA MT4
- TMA MT5
- TMA Redrawing
- Trade with TMA
- Triangular Moving Average
- What is the Triangular Moving Average
- What is TMA
- What is Triangular Moving Average


