Dynamic Trend Duo EA: Trend Following Scalper with Recovery Mechanisms
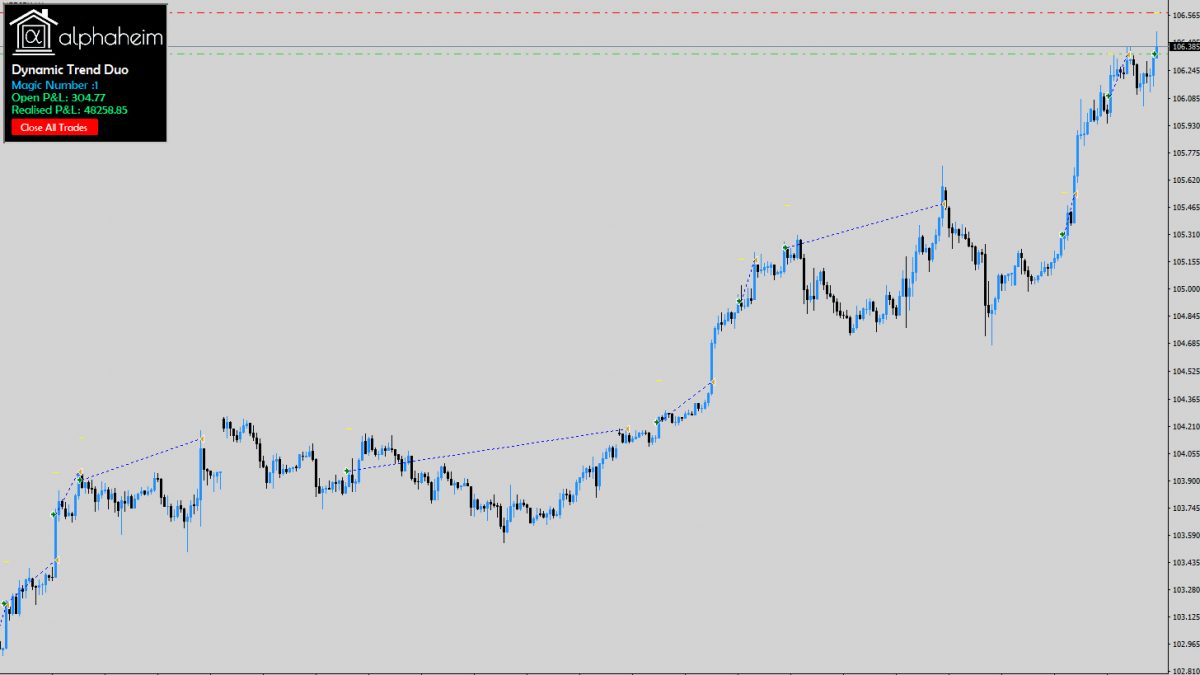
The alphaheim Dynamic Trend Duo, also known as DTD, is a fully automated trading system for MetaTrader 4 & 5 which is designed to trade with the market trend according to two propriety indicators.
The EA will trade with the direction of the longer-term trend, whilst taking trading triggers based on market trend structure. Whilst this is the default configuration of the EA, the criteria can be reversed to take entries with the trend direction change, and confirmation from the trend structure.
Table of Contents
Live Performance Tracker
You can track our portfolios by clicking on the myfxbook trackers below!
How Does the Expert Advisor Work?
In this article, we will explore the default configuration of the EA. We also have a video walkthrough for the system posted below.
Trend Depth Bias
The Trend Depth bias provides the initial signal for a trade within the EA.
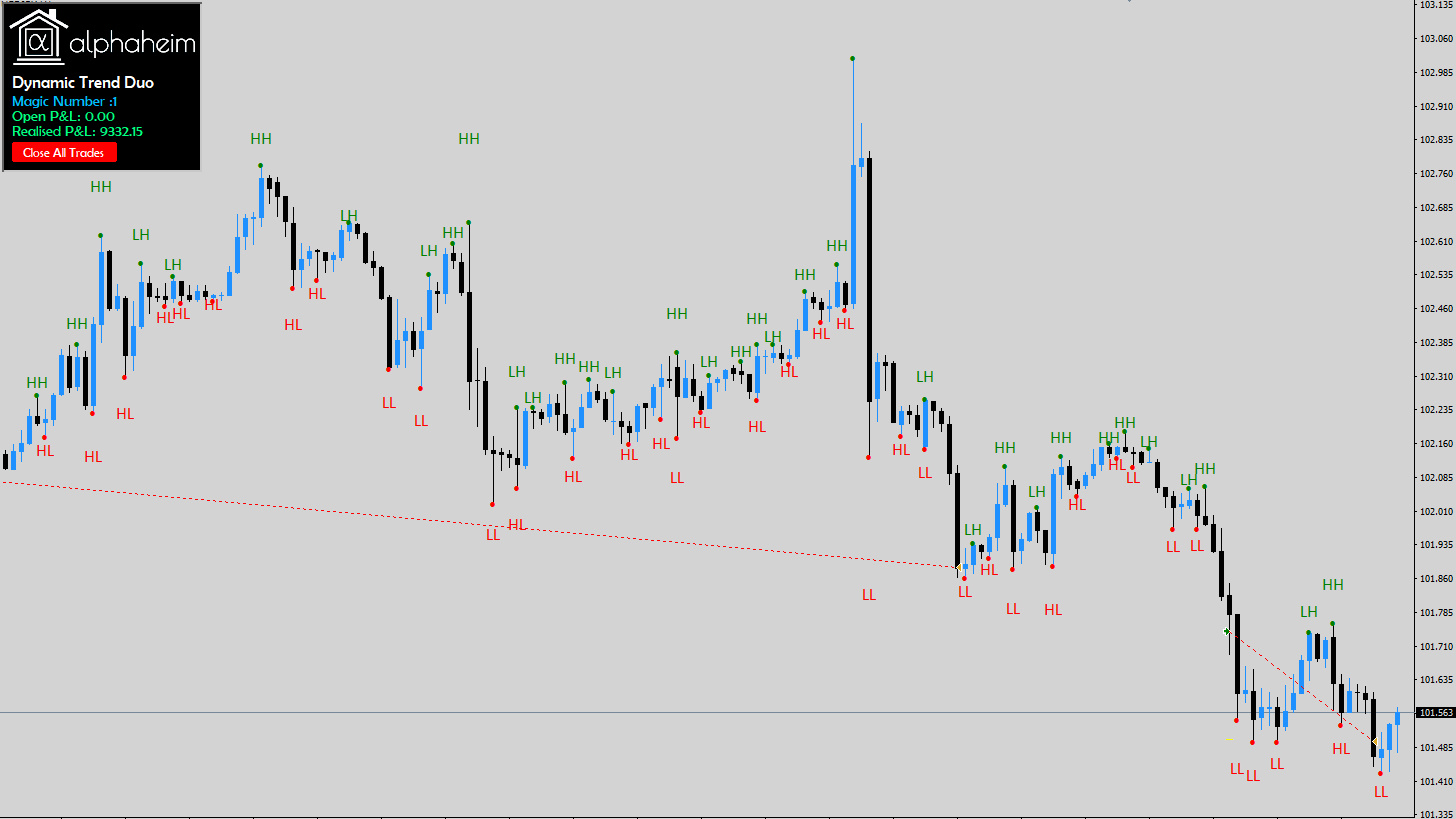
Our proprietary Trend Depth indicator analyses the behaviour of fractals with specified depth. The formation of a single Higher High (HH) or Lower High (LH) does not automatically shift the Trend Depth bias to bullish. The reverse logic for Lower Lows (LL) and Higher Lows (HL) has a similar irrelevance for a bearish bias.
The algorithm uses the key points relative to other critical metrics, and then assigns a bias of bullish, bearish or ranging.
For a bullish trade, we seek a new bullish Trend Depth break, with the previous candle indicating a region of consolidation, or of a bearish bias.
Price Action Shackle
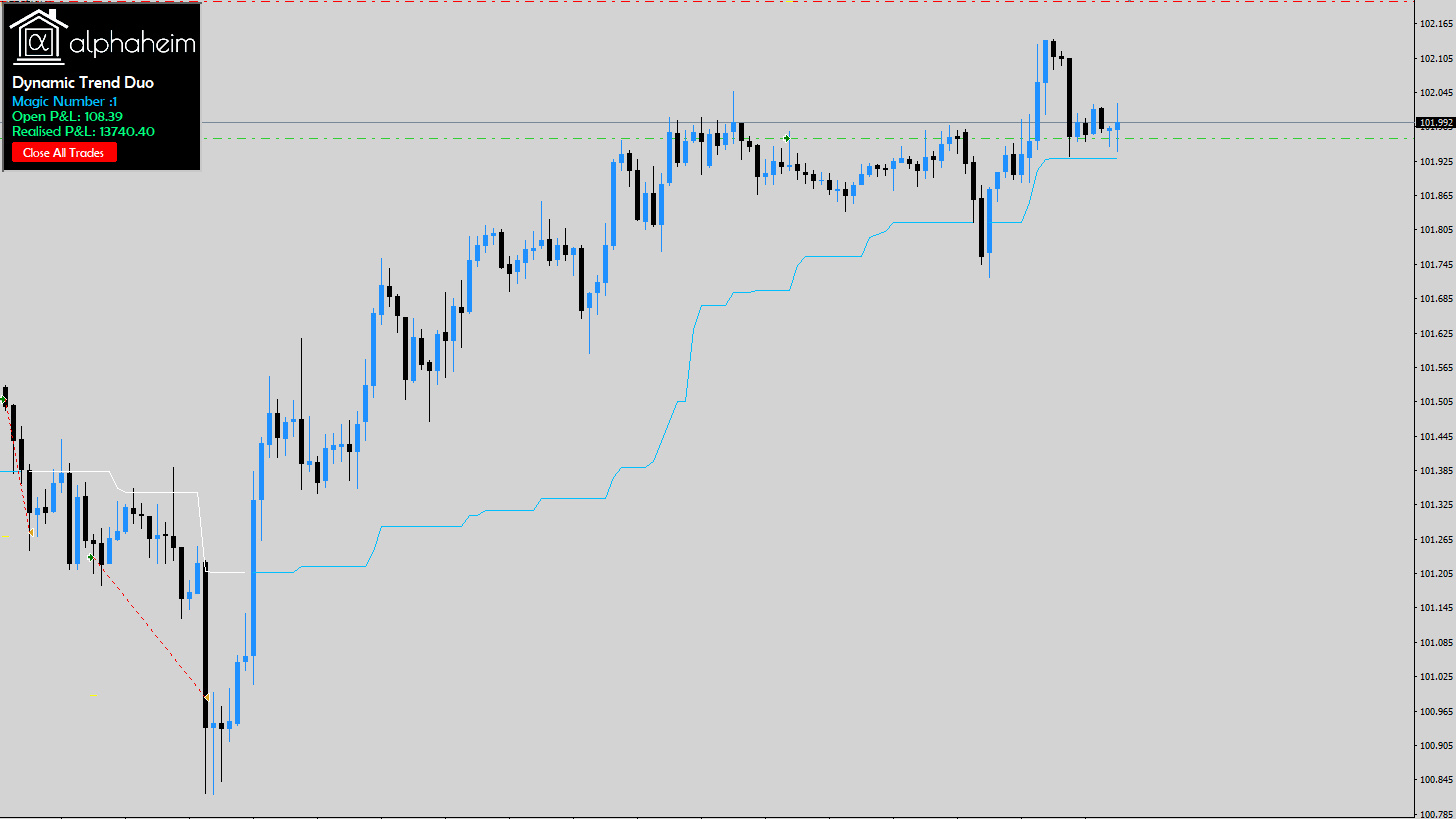
Once we have confirmed the trigger from the Trend Depth, we then seek to confirm the direction of the trend through our Price Action Shackle.
The shackle inspects the close price, or current price in the case of the current candle, relative to the behaviour of highs and lows within the defined Shackle Length. Subsequently, a bias is generated for price action, resulting in either a bullish or bearish sentiment.
The vast majority of indicators will determine the trend exclusively on close prices. Our shackle indicator will blend the values from the highs and lows and determine the current sentiment in the market, without enforcing typical lags.
Dynamic Risk Management
Our DTD EA grows the account utilising dynamic risk management, with a strong factoring of current market volatility.
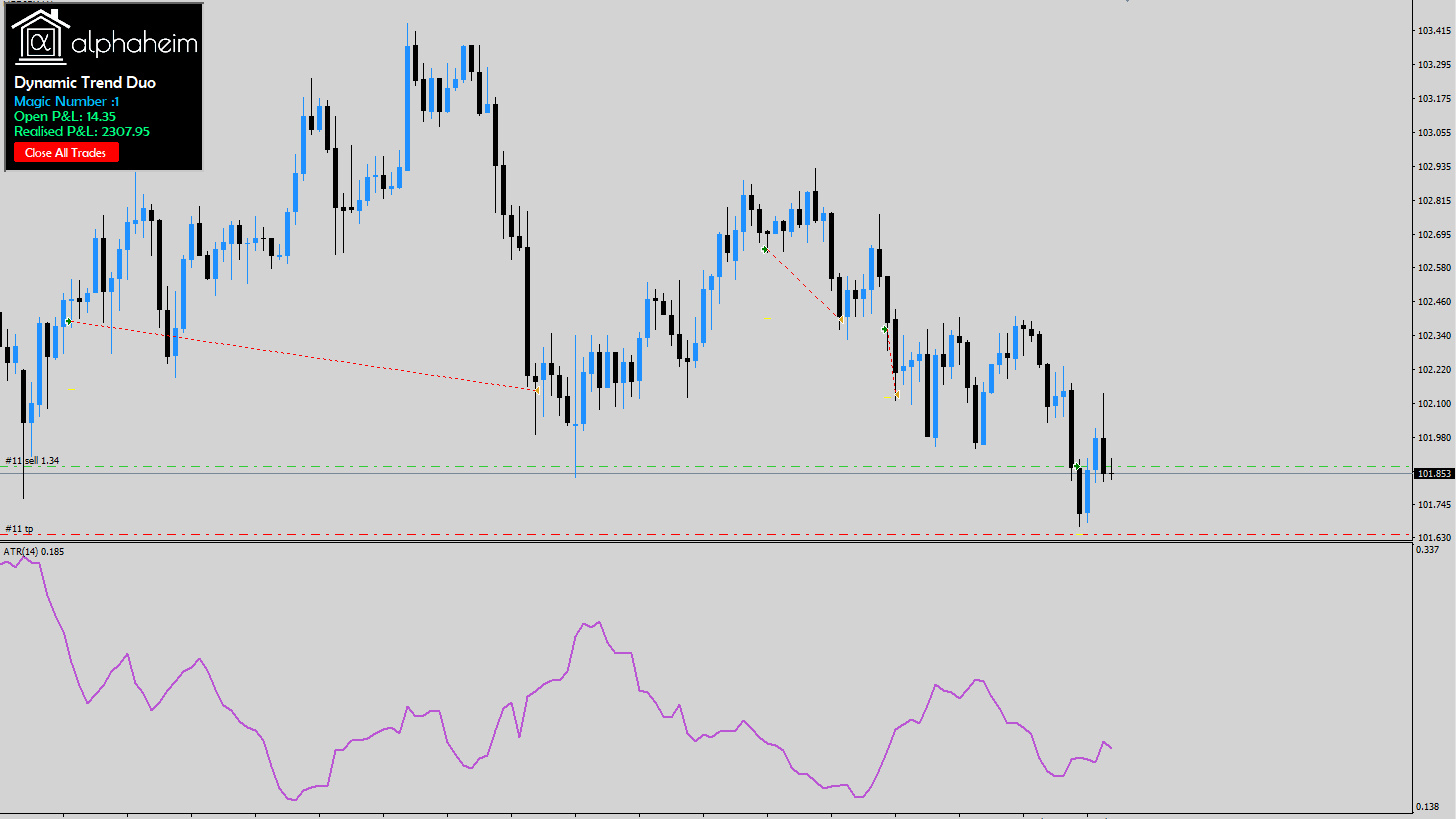
The EA will inspect the value of the Average True Range, ATR, to gauge the volatility and set the initial trading lot size accordingly. In this example, the ATR reading allures to subdued market volatility [2], allowing for a larger base lot size.
Over the years, the general trading activity within any given symbol changes. For example, the average daily range on EURUSD 8 years ago, is vastly different than in 2021. This is why the DTD will assess the state of the market in which it operates, and extend the trading sizes where volatility is subdued, and lower in circumstances of increased activity.
Recovery Mechanism
The ideal DTD operation allows multiple trades, and thus lowering the target price level, in the case of an incorrect signal. This means that when the maximum number of trades is set to higher than 1, there will be a one directional grid forming.
The target for the grid will be based on the average buying price plus the user defined target (in pips).
For example, if the first trade is entered at 1.00000, with the 2nd trade entered at 1.01000, if the TP is set to 20 pips, the resultant target of both trades will be:
(1.00000+1.01000)/2 + (20*0.0001) = 1.00500 + 0.00200 = 1.00700
For our US clients, we have added functionality to allow for FIFO compliant trading .
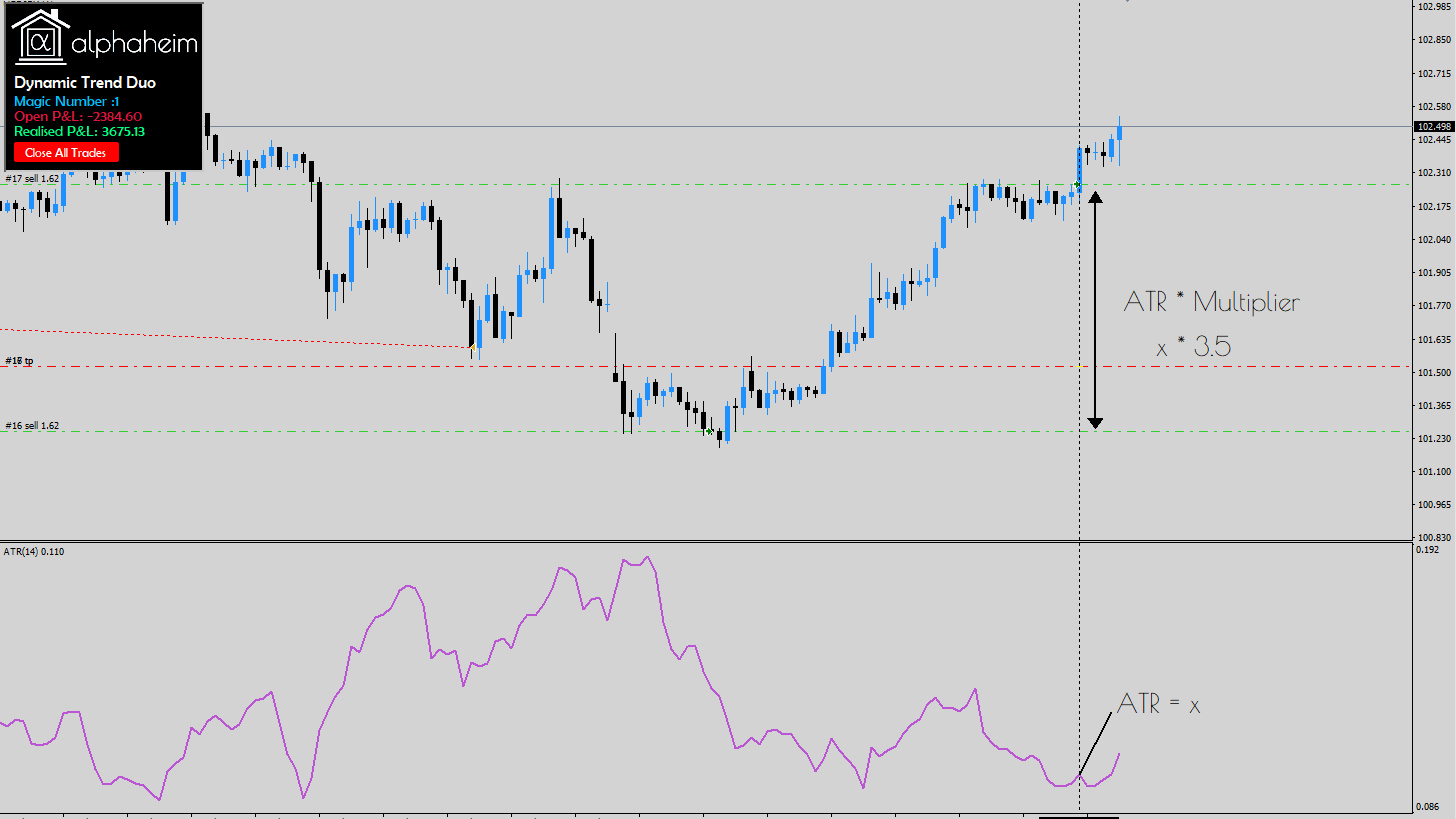
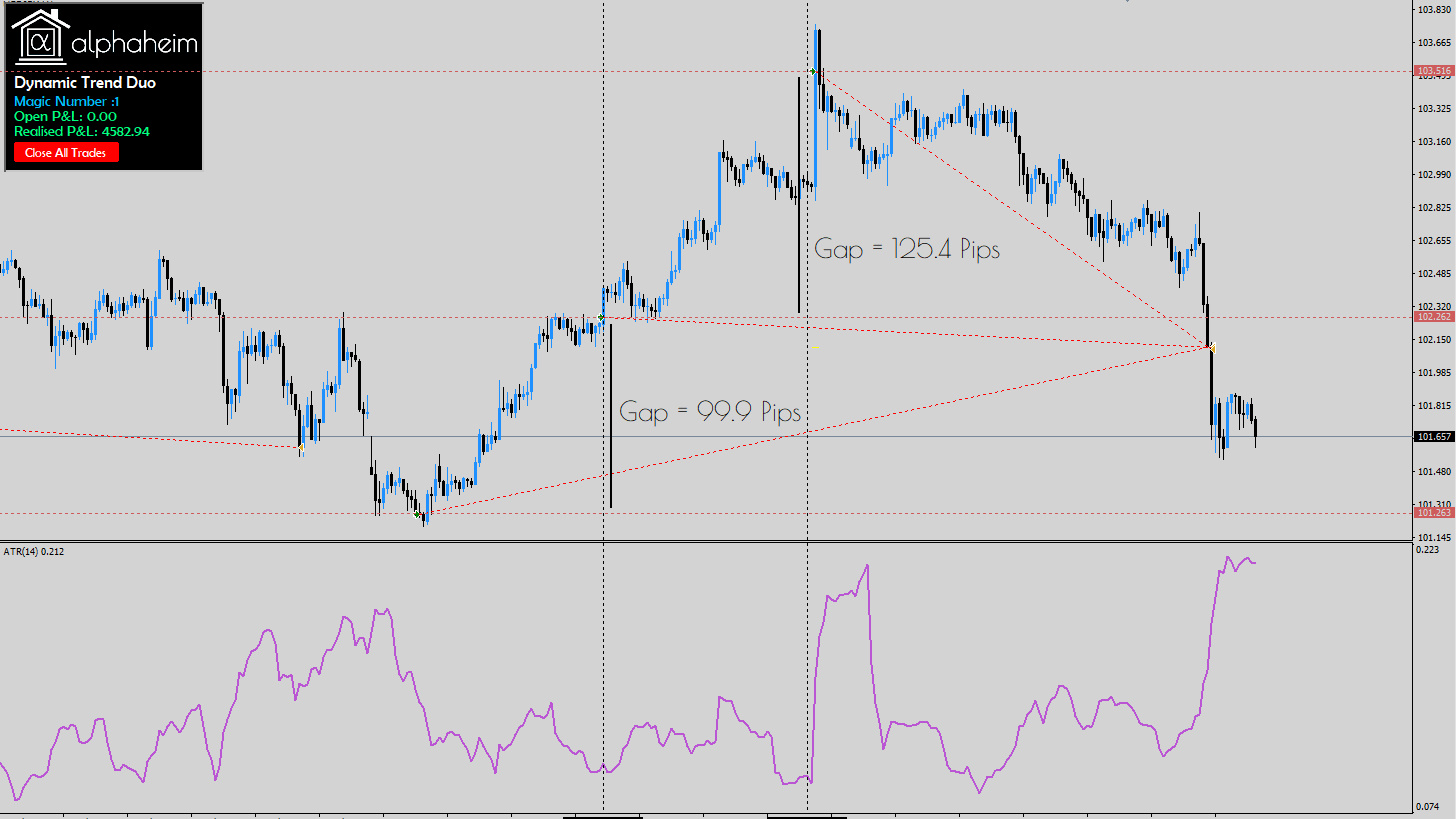
The gap between successive trades is once again determined by volatility within the market. In this example, an incorrect signal was provided, and a subsequent trade, in the direction of the original trade was entered. The trade was entered when the market Bid price exceed a user defined multiple of ATR. In this case, the multiplier was set at 3.5.
Following on from the previous example, the market continued to push higher, against the initial signal. A further trade was entered, but at a greater gap than the initial distance. This increased volatility assessment allowed for a more accurate entry point for the recovery trade and closed the basket in profit shortly after.
Swift Optimizations
Most EAs require an optimisation on every single timeframe in order to assess viability. Our DTD EA allows for a single optimisation to account for all timeframes within MetaTrader’s capabilities, giving more time to test your strategy in real time. The added functionality also allows both indicators to use separate timeframes, creating scope for a multi-timeframe strategy.
What Risk Percentage Should I Use?
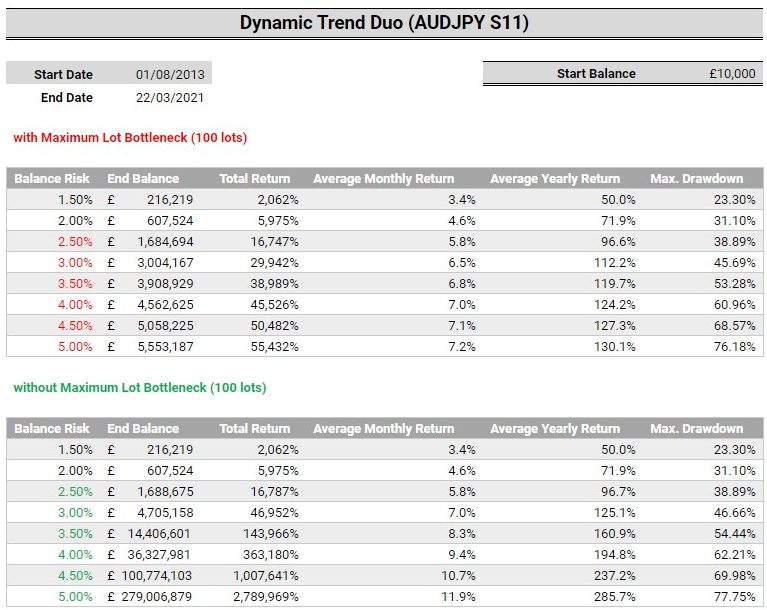
The data in the tables below indicate what returns can be expected, with their respective expected maximum draw-down. Due to the nature of the system, we have reported the Maximum Relative Equity Drawdown. This value will represent the maximum loss the account endured, prior to recovery of all previous profits, and the current basket closing in a profit.
All of the data provided below are for the AUDJPY S11 configuration.
Brokers typically impose maximum lot size restrictions. Whilst this may not be a concern at the moment, we need to remove this restriction to truly assess the maximum risk possible, at any given time.
To elaborate on this further, take the case where the EA has performed superb for 7 years, then the lot size is reduced to the maximum lot size. This means the EA is taking lesser risk then the balance should be taking. This lesser risk will result in a lesser draw-down then should be represented in the maximum drawdown.
It is our recommendation to make your assessment on risk, based upon the table with maximum lot size restrictions removed. Please do not take note of the total balance. The key figures are the average monthly returns, and the maximum draw-down.
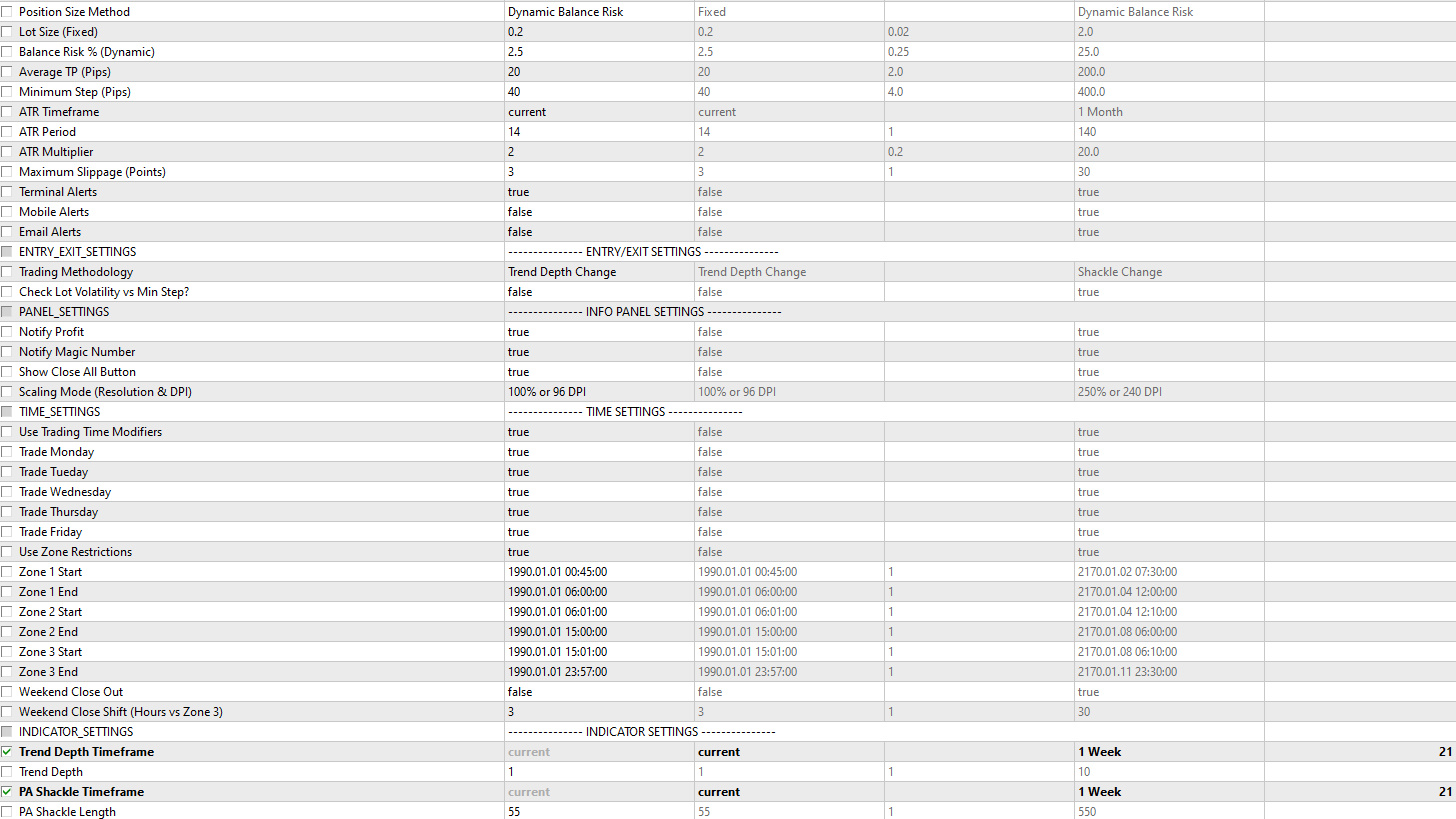
The default configuration of the set file is to risk 2.5%. As soon as our current basket of trades has been closed, we will be changing this value to 3.5%. We urge you to base your value dependent on your risk tolerance, as well as the intended return.
Please also note, the average monthly returns are an average. There will be months will lesser returns, and others with greater. There is also scope for the EA to hold a drawdown for an entire month.
Links for the Dynamic Trend Duo EA
Visit the Dynamic Trend Duo Expert Advisor Subscription Page
User Guide & Documentation for the Dynamic Trend Duo EA
YouTube: Dynamic Trend Duo Scalping EA with Trend Following
Medium Link for this Dynamic Trend Duo Article
MetaTrader Trading Indicators & EAs
For indicators and EAs other than our Grid EA, check out the links below:
Trend Bias Indicator
Grid Expert Advisor
TMA Indicator
Trend Divergence Indicator
Volume Insight & Divergence Indicator
All alphaeim EAs, Indicators & Dashboards
alphaheim Trading Tools for MetaTrader


