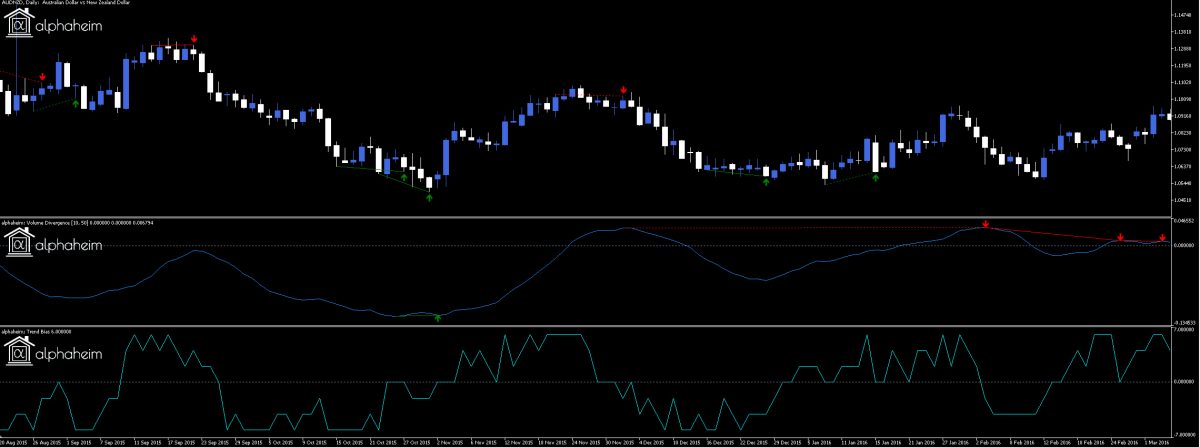
It is unwise to assume that any given system can predict future movements within financial markets – but by combining informed decision making and strict risk management, it is possible to trade with an edge and generate consistent alpha. In this article we will discuss ways on how to trade reversals. We go over a highly effective reversals trading strategy which has been vetted for a variety of markets, inclusive of forex, equities and commodities.
Table of Contents
How to Trade Reversals
When inspecting an arbitrary price chart, it is immediately apparent that prices neither continuously fall or rise. From a price action perspective, asset prices have set tendencies, and these same tendencies occur across asset pairs, and have varying relevance year to year. The strategy discussed within this article utilises three key tenants.
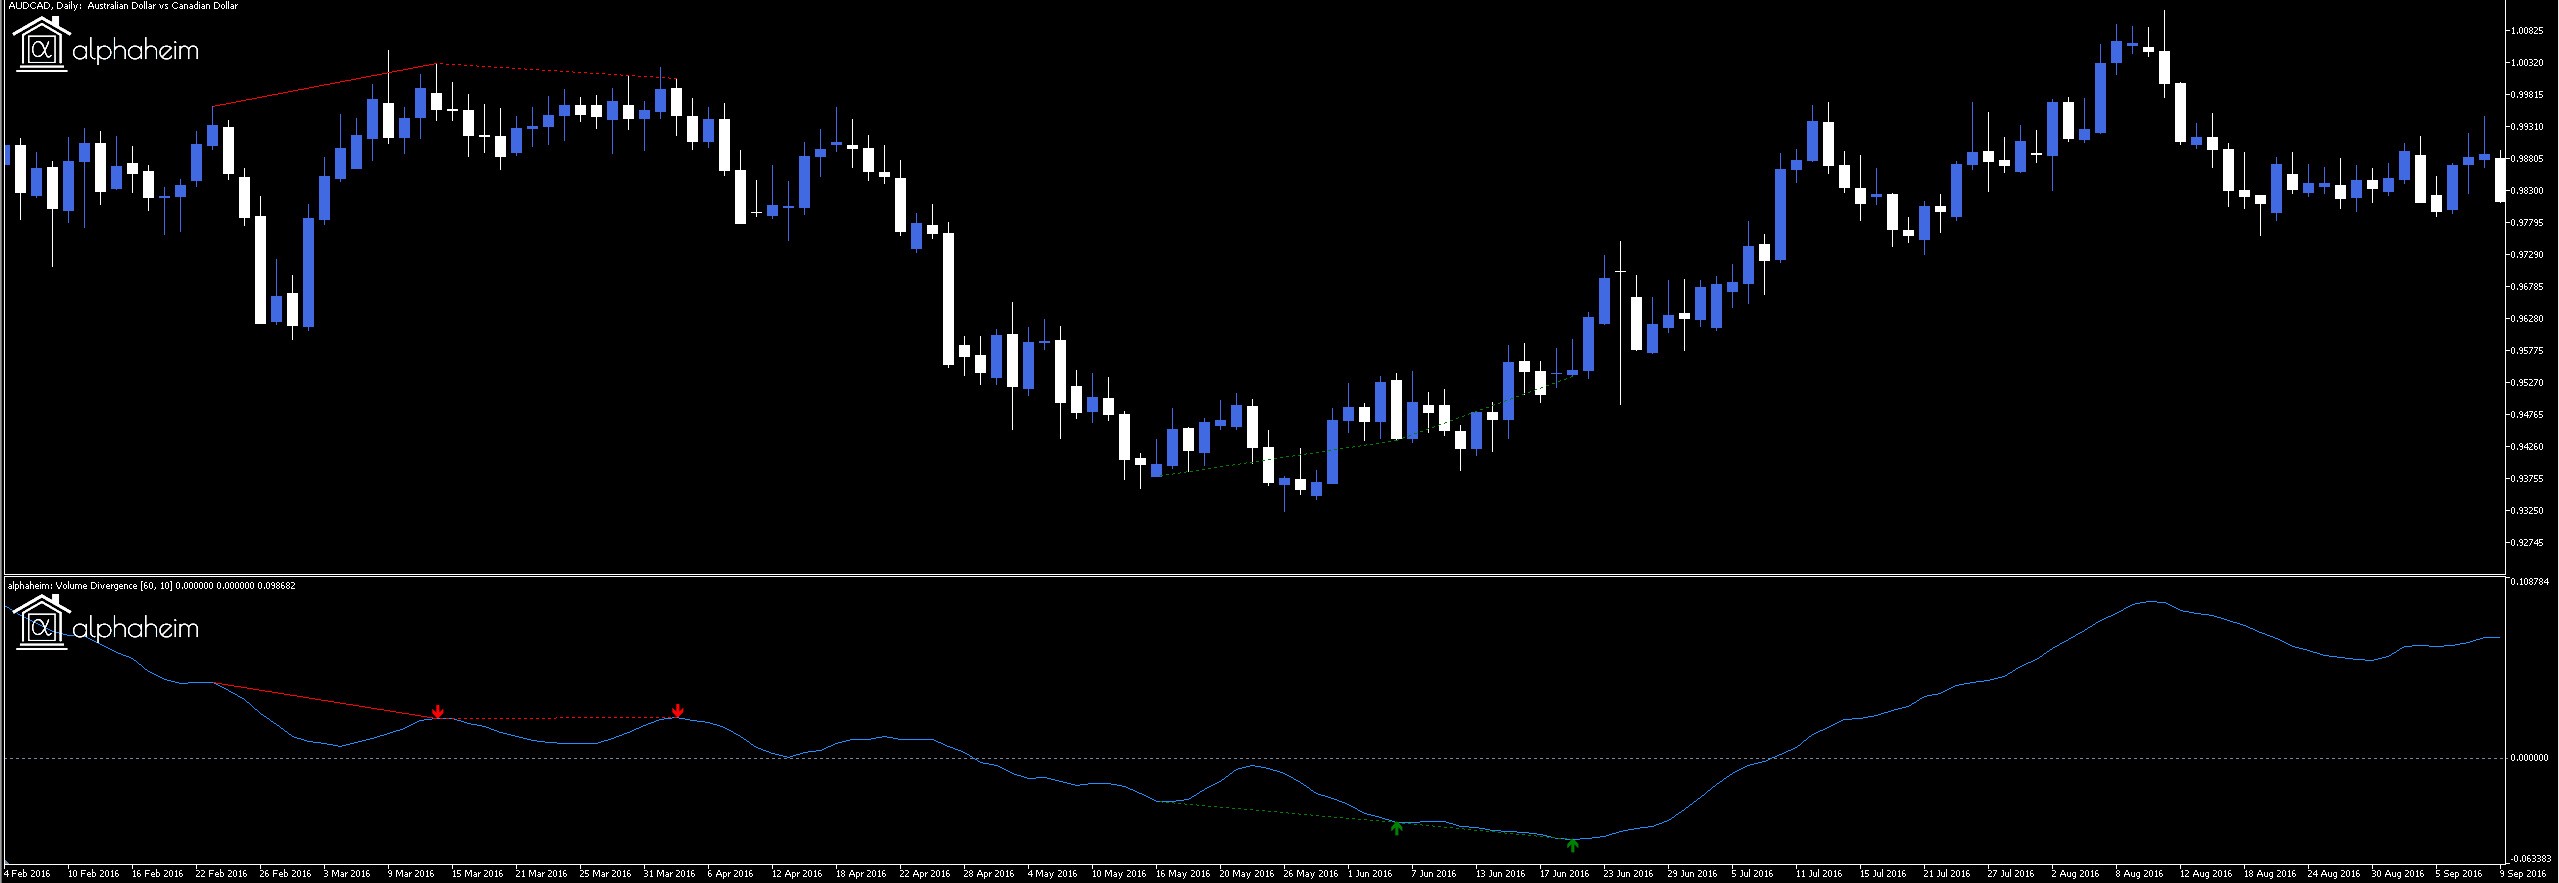
Volume Divergence Indicator
In the case of Forex markets, both retail and professional traders have a minute impact on the overall trading volume. For this reason, it is important to analyse the large inflows of volume which induced the price shifts, and the nature of the inflows/outflows.
We can aggregate recent shifts in volume, apply a smoothing algorithm and assign a directional bias. This will form our Volume Insight, from which we can inspect for specific regular and hidden divergences.
The effectiveness of volume divergence analysis depends directly on the volume data provided from your broker. In the case of brokers utilising a lesser number of liquidity providers, there could be a notable variation in tick volumes which may distort the truthfulness of the divergence.
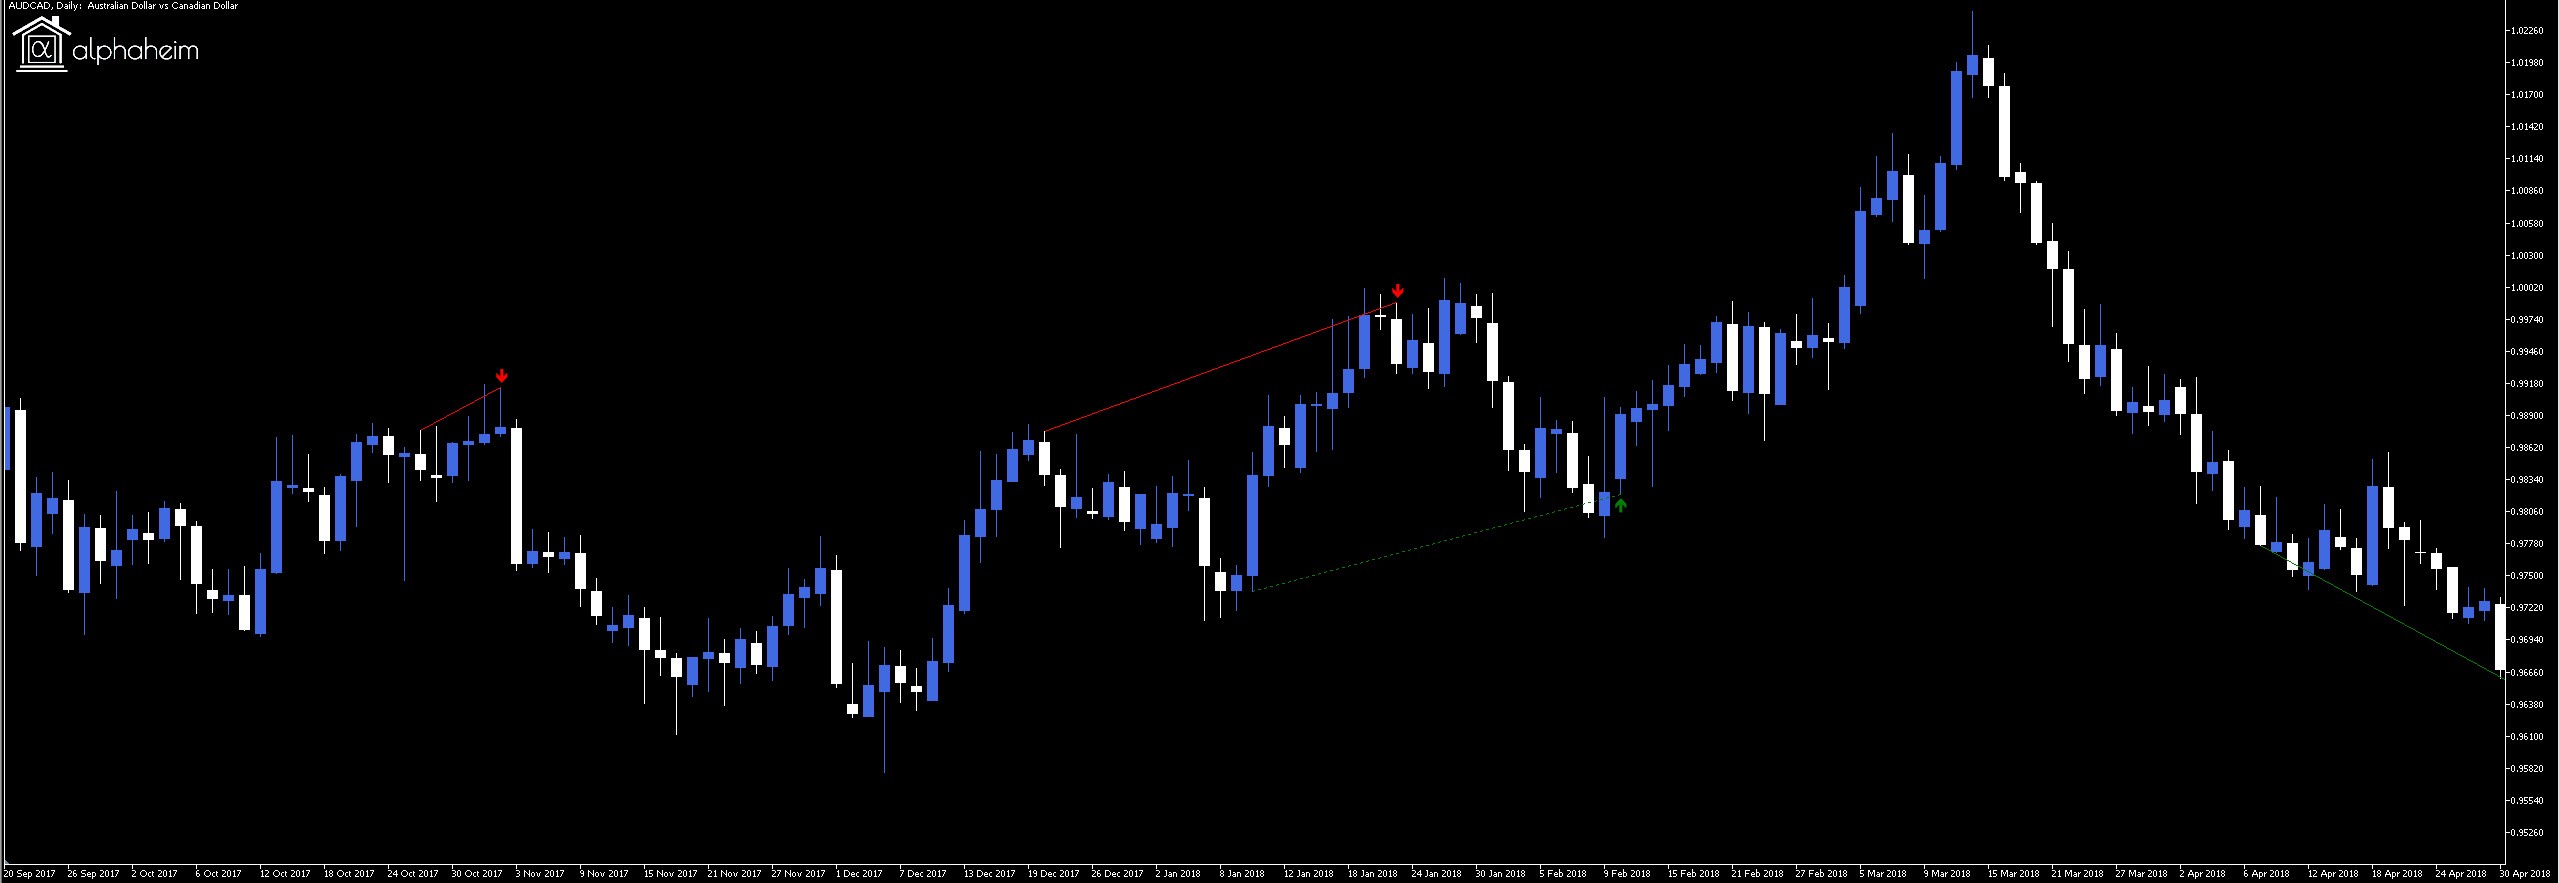
Trend Divergence Indicator
In order to gauge a possible trend reversal, it is important to understand that markets have cyclical tendencies. In this case, we refer to cyclical behaviour from a trigonometric approach rather than an economics approach.
We can attempt to create an exact synchronisation of the current price with the current trend cycle, to perform an underlying cyclical price action prediction. Subsequently, we can perform a historical analysis of the data to seek for divergences.
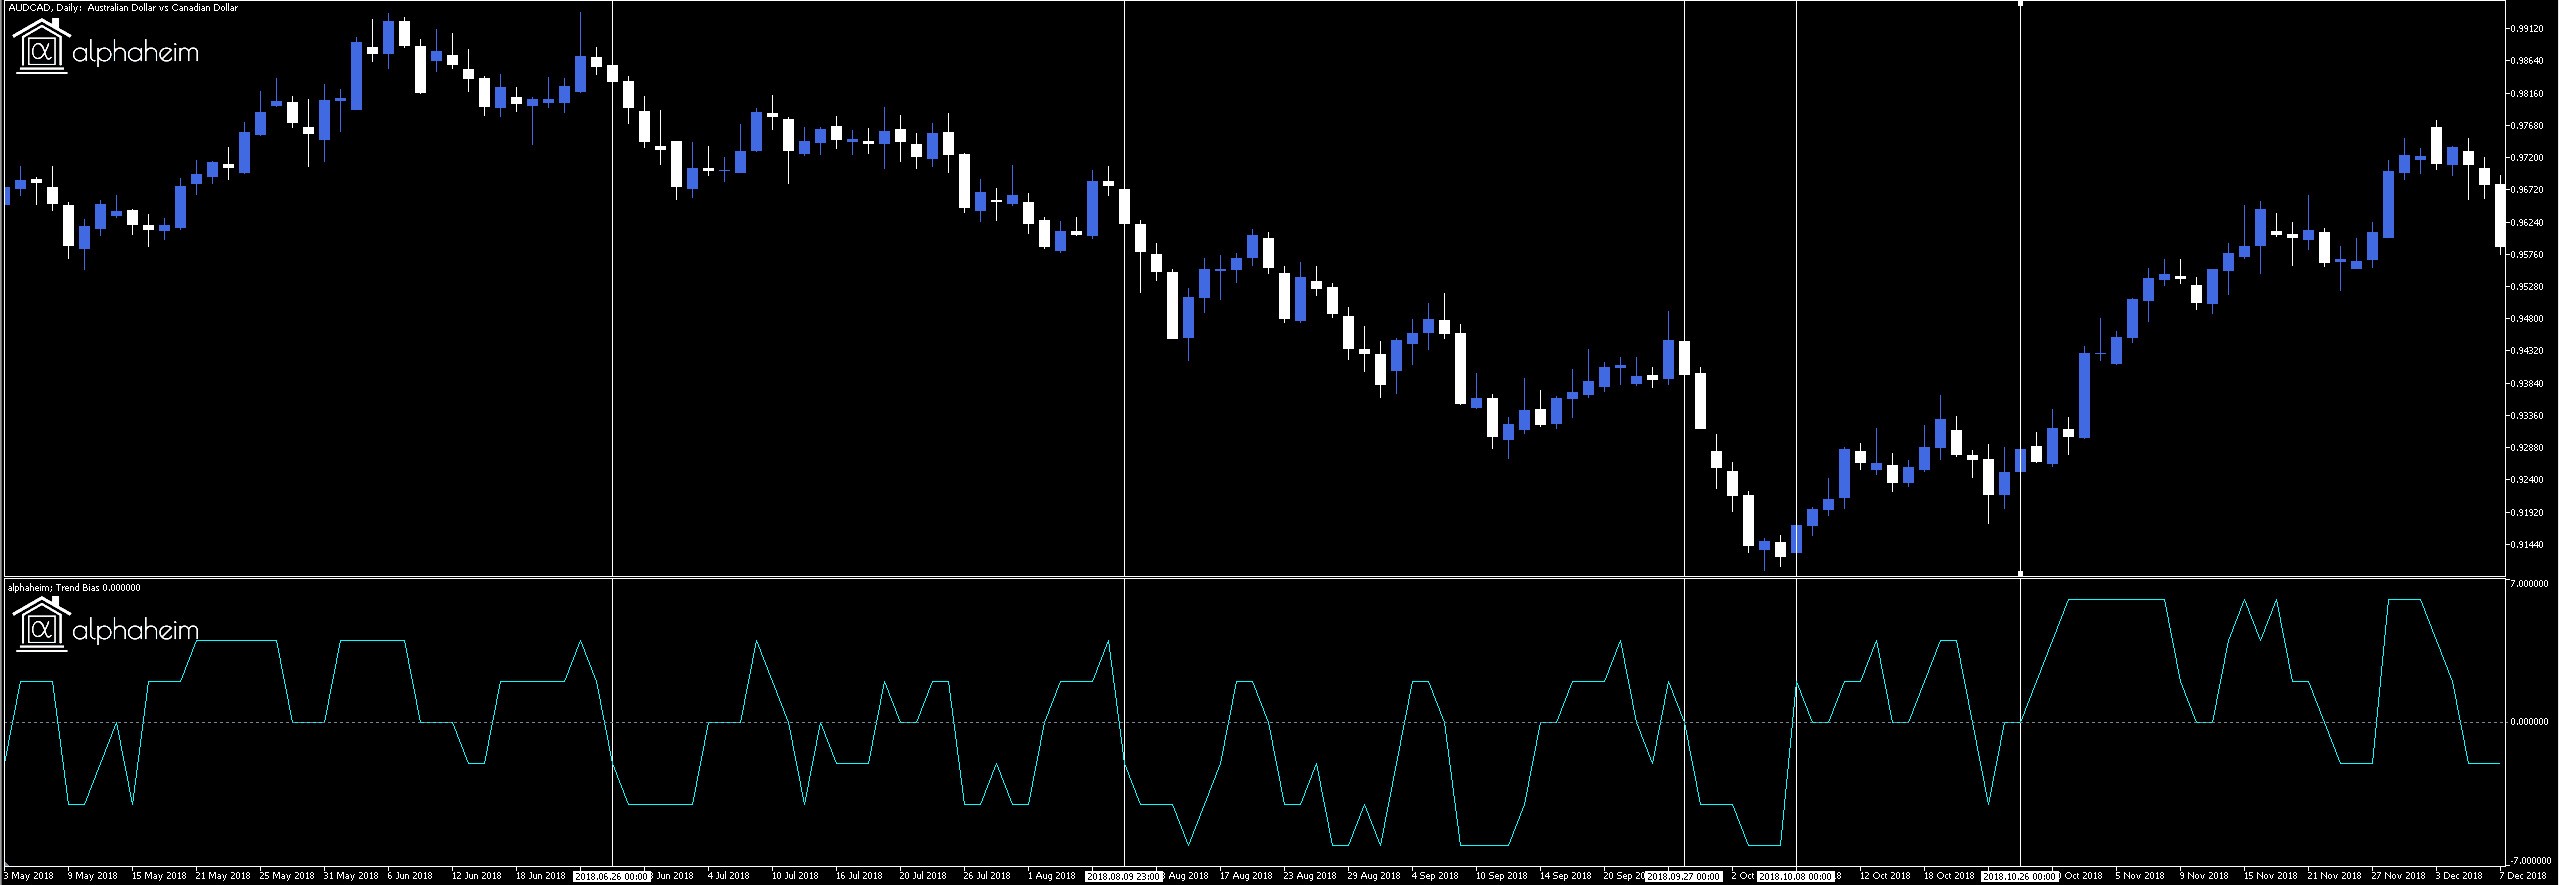
Trend Bias Indicator
The analysis provided in the preceding points gives us a good indication of a possible reversal, but does not provide sufficient information about the immediate sentiment within the market.
By utilising our proprietary points-based scoring mechanism we can get an instantaneous picture of the market direction, with a heavily reduced lag. The choppiness of our Trend Bias indicator is a direct result of the signals processing algorithm, and helps improve the trading probabilities within the overall strategy.
Trade Signal Criteria for Trading Reversals
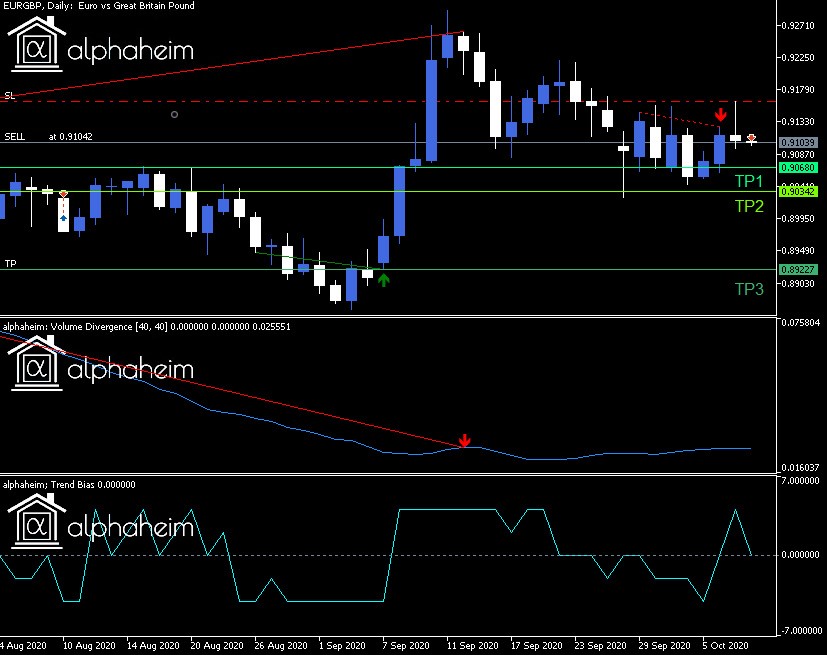
Alignment of Volume Divergence and Trend Divergence
-
- There must be a volume divergence and trend divergence within a short span. We like to use a span of 10 candles, but often extend to 20 candles under exceptional circumstances.
- At least one of the two divergences should be on candle 3, with candle 1 indexed as the current candle.
- Optional: Trade entry price must be in the direction of the divergence signal, and respect the Trend Divergence signal location.
- For example, take an arbitrary long position where a bullish volume divergence and bullish trend divergence have been confirmed. The point of trade entry must be above the signal value for Trend Divergence.
- Optional: Trade entry divergence delta must be within the initial divergence price action width, or a maximum multiple of.
- For every tradeable signal, there will be two price action divergences, one for volume, and one for trend. Take the largest price differential in divergence, and compare with the current price. If, for example, price has already exceeded the divergence limit, you may wish to reject the trade.
Trend Bias Confirmation
-
- We now seek a confirmation of the trade.
- Depending on your appetite to trade, you can vary the threshold for trade entry.
- The maximum values for bullish bias and bearish bias are +6 and –6
- For a long trade, we seek a trend bias of 0 or greater. In uncertain markets, or where the risk is greater, we seek higher bias values for entry.
Trend & Divergence Reversals Trading Strategy
Stop Loss
-
- Our preferred method utilises a combination of recent swing highs and lows with ATR.
- Take the case of a long. If the trade entry price is greater than a multiple of ATR away, then entry the trade with SL set at the swing low. If this rule is not respected, take the swing low and subtract a multiple of ATR to give some breathing room for the signal.
Take Profit
-
- We set the vast majority of our trades with 3 TP values, but sometimes reduce to only 2.
- TP multipliers vary across different timeframes, but typically start with TP1 around the 0.618 region, ranging to 4 for TP3.
Risk Management
-
- We often shift our SL to Break-even when TP1/TP2 has been met.
- If TP3 is being used, we trail the position with a dynamic trailing stop. The size of the trail is determined by the distance between TP1 and TP2.
Disclaimer
Due to the nature of financial markets, technical edges tend to fade with increased market activity surrounding similar signals. In order to protect the integrity of this system, we will be limiting the availability of the tools mentioned within this blog. Similarly, this post will continue to exist, so long as the tools are publicly available.
When the maximum threshold has been met, our existing users will be able to trade as normal, but new registrations will not be permitted.
Trend & Volume Divergence Links
Visit the Volume Divergence Indicator Subscription Page
Visit the Trend Divergence Indicator Subscription Page
Visit the Trend Bias Indicator Subscription Page
User Guide & Docs for the Volume Divergence Indicator
User Guide & Docs for the Trend Divergence Indicator
User Guide & Docs for the Trend Bias Indicator
YouTube: Reversals Technical Trading Strategy
Medium Link for this Reversals Trading Strategy Article
MetaTrader Trading Indicators & EAs
For indicators and EAs other than our the indicators mentioned in this article, check out the links below:
Dual Grid Expert Advisor
Triangular Moving Average Indicator
Dynamic Trend Duo Expert Advisor
All alphaeim EAs, indicators & Dashboards
alphaheim Trading Tools for MetaTrader


